Aurora forecast / When and where
When and where to see the northern lights in Iceland
Most aurora advice is written from impressions. This is written from 20 years of hourly cloud records (2006-2025) and the planetary Kp index (2006-2025), for 29 places across Iceland, with the cloud figures corrected against 31 Icelandic weather stations that have been recording sky cover by eye for decades.
So far this winter
Since 1 September, Iceland has had 1,989 hours of clear dark sky against a normal of 1,633 by 2026-10-22 — 21.8% ahead of average, measured over 52 nights.
What actually stops you is the sky, not the sun
Across every dark hour of the last 20 years, geomagnetic activity was strong enough to be worth watching 42.2% of the time. The sky was clear enough to see anything 14.9% of the time. Both together: 6.3%.
Solar activity is roughly 2.8x more available than clear sky in Iceland. That is why an app that shows you a Kp number is answering the wrong question here: Iceland sits underneath the auroral oval, so the aurora is very often already there. What you are really gambling on is cloud.
The best month
December gives you the most usable hours — about 72.1 hours of clear dark sky in an average month, from 463.4 dark hours. But the most geomagnetically active month is September, at a mean Kp of 1.8. Darkness peaks in midwinter and activity peaks near the equinoxes, so the two never line up.
| Month | Dark hours | Clear dark hours | Usable share | Mean Kp |
|---|---|---|---|---|
| January | 437.8 | 59.3 | 13.5% | 1.5 |
| February | 332.9 | 47.8 | 14.4% | 1.7 |
| March | 265.5 | 40.2 | 15.2% | 1.8 |
| April | 104.5 | 18.1 | 17.4% | 1.8 |
| May | 0 | 0 | — | 1.6 |
| June | 0 | 0 | — | 1.6 |
| July | 0 | 0 | — | 1.5 |
| August | 43.7 | 7.1 | 16.2% | 1.6 |
| September | 214.1 | 32.5 | 15.2% | 1.8 |
| October | 332.7 | 50.1 | 15.1% | 1.7 |
| November | 405.9 | 59.8 | 14.7% | 1.5 |
| December | 463.4 | 72.1 | 15.6% | 1.5 |
Hours per month, averaged over 2006-2025.
The best place
Grouped into tiers, not ranked one to 24. Places inside a tier are within the error of the measurement, so putting one above another would be inventing a difference.
Tier 1 — Kirkjubæjarklaustur (537 h), Hella (511 h), Grindavík (499 h), Reykjavík (485 h)
Tier 2 — Keflavík (478 h), Borgarnes (458 h), Skaftafell (442 h)
Tier 3 — Stykkishólmur (413 h), Þingvellir (410 h), Mývatn (408 h), Vík í Mýrdal (399 h), Ásbyrgi (389 h), Skógar (385 h), Húsavík (381 h)
Tier 4 — Patreksfjörður (361 h), Arnarstapi (356 h), Seyðisfjörður (344 h), Egilsstaðir (330 h)
Tier 5 — Hvammstangi (320 h), Landmannalaugar (320 h), Sauðárkrókur (316 h)
Tier 6 — Hólmavík (270 h), Akureyri (267 h)
Tier 7 — Ísafjörður (207 h)
Clear dark hours per year. Places whose nearest long-record weather station is too far away to calibrate against are left out rather than ranked on an uncorrected figure.
Why these numbers differ from the raw model
The reanalysis everyone uses for this kind of question resolves about 11 to 15 km, which is coarser than the fjords and rain shadows that decide whether an Icelandic valley is cloudy. Measured against 31 Icelandic stations with decades of hand-recorded sky cover, its largest error is at Reykjahlíð, where it reports 6.6 points more cloud than observers actually recorded.
The effect is not a rounding difference. On the raw model Mývatn has the 12th lowest average cloud of the 24 places ranked here; measured against what observers actually wrote down it has the 2nd. Every figure on this page is corrected, against 31 stations over 1991-2020.
It still sits 10th on usable dark hours above, which is not a contradiction: low average cloud and many clear winter nights are different things. A place can be clear more often than average and still have its clear spells fall in summer, when there is no darkness to use them.
The best year
Geomagnetic activity follows the eleven-year solar cycle, and the difference between the top and the bottom of it is not subtle. The strongest season in this window was 2024/25 (mean Kp 2.4, storm-level activity 4.9% of the time); the quietest was 2009/10 (mean Kp 1, storms 0.7%). The most recent full season, 2024/25, ran at a mean Kp of 2.4.
| Season | Mean Kp | Storm-level hours |
|---|---|---|
| 2006/07 | 1.6 | 1.7% |
| 2007/08 | 1.6 | 0.8% |
| 2008/09 | 1.1 | 0.2% |
| 2009/10 | 1 | 0.7% |
| 2010/11 | 1.4 | 1% |
| 2011/12 | 1.6 | 2.2% |
| 2012/13 | 1.6 | 2.3% |
| 2013/14 | 1.4 | 1.1% |
| 2014/15 | 1.9 | 2.1% |
| 2015/16 | 2 | 3.9% |
| 2016/17 | 2 | 2.4% |
| 2017/18 | 1.7 | 1.8% |
| 2018/19 | 1.4 | 0.8% |
| 2019/20 | 1.2 | 0.5% |
| 2020/21 | 1.4 | 0.5% |
| 2021/22 | 1.7 | 1.3% |
| 2022/23 | 2.1 | 2.4% |
| 2023/24 | 1.8 | 2.9% |
| 2024/25 | 2.4 | 4.9% |
Seasons run July to June so one aurora winter is one row. Planetary Kp index, GFZ Potsdam, 2006-2025. This series is national and complete, so it spans a wider period than the cloud figures above.
How this was measured, and what it cannot tell you
Hourly cloud cover from the ERA5 reanalysis for 29 places, 2006-2025, corrected against 31 Icelandic weather stations; the planetary Kp index from GFZ Potsdam; darkness computed from the real position of the sun rather than assumed from the calendar. A "clear dark hour" is one where the sun is more than 12° below the horizon and corrected cloud cover is 40% or less.
What it cannot tell you: anything at a finer scale than about 15 km, so this ranks regions and towns, never one waterfall against the next. It is a correction to the average level of cloud, not to its hour-to-hour pattern. And it is climate, not forecast — it tells you which month and which region to book, not what tonight will do. For tonight, use the live forecast.
Tonight's aurora forecast · Iceland weather map · Month-by-month guides
Twenty years says when. This says where.
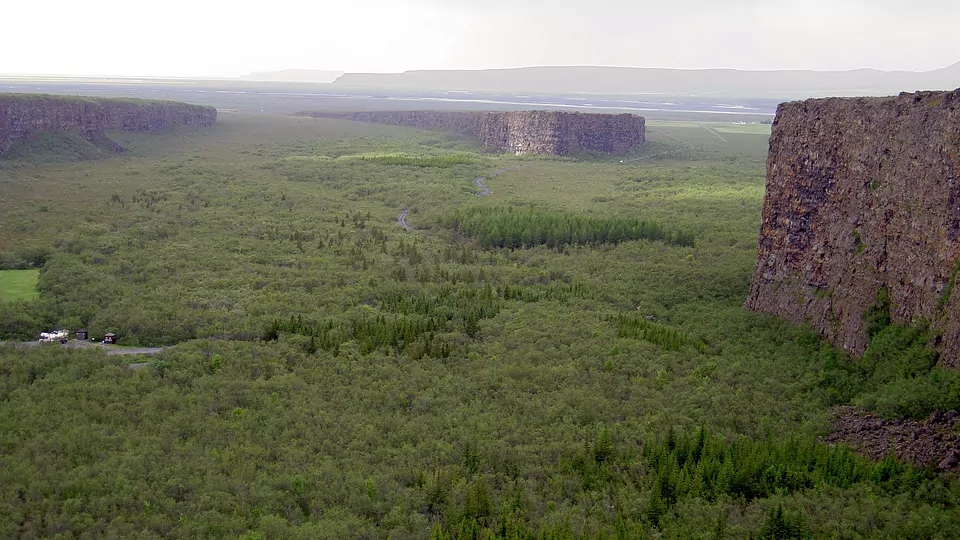
Step inside Asbyrgi — narrated, and dark enough for the lights when the sky clears.